The NOVA food classification system is the most widely used framework for understanding what makes food "ultra-processed." Developed by nutrition scientists at the University of São Paulo, NOVA doesn't look at calories, fat, or sugar — it classifies food based on the degree of industrial processing it has undergone [1].
If you've ever searched for "nova classification system," "nova food classification," or "what is NOVA 4," this is the definitive guide. We'll break down each NOVA group with real examples, explain why it matters, and show you how to track your own NOVA 4 consumption.
What Is the NOVA Classification?
NOVA was introduced by Dr. Carlos Monteiro and his team at the University of São Paulo in 2009. Unlike traditional nutrition science, which focuses on nutrients (protein, carbs, fat), NOVA focuses on what has been done to the food before it reaches your plate.
The system groups all foods and beverages into four categories:
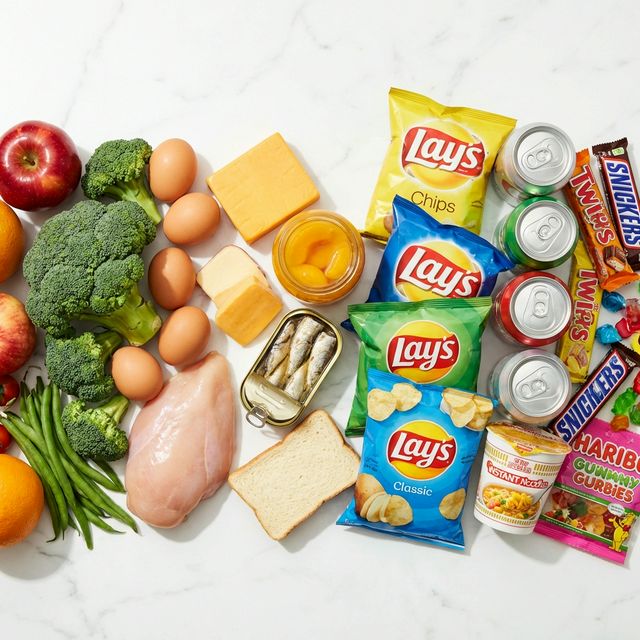
NOVA Group 1: Unprocessed & Minimally Processed Foods
These are foods obtained directly from plants or animals that have undergone no processing, or only minimal processing designed to preserve them or make them safe to eat. Minimal processing includes washing, peeling, refrigerating, pasteurizing, fermenting (without alcohol), freezing, or vacuum-packaging.
| Category | Examples |
|---|---|
| Fruits & Vegetables | Apples, spinach, broccoli, bananas, berries, carrots |
| Grains & Legumes | Brown rice, oats, dried beans, lentils, quinoa |
| Animal Products | Fresh chicken, beef, pork, eggs, fresh fish, plain milk |
| Nuts & Seeds | Almonds, walnuts, sunflower seeds (unsalted, unprocessed) |
| Other | Plain yogurt, tea, coffee, water, frozen vegetables (no sauce) |
Key rule: If it came from the ground, a tree, or an animal and has no added ingredients — it's NOVA 1.
NOVA Group 2: Processed Culinary Ingredients
These are substances extracted from Group 1 foods or from nature, used in kitchens to prepare, season, and cook Group 1 foods. They are rarely consumed on their own.
| Category | Examples |
|---|---|
| Oils & Fats | Olive oil, coconut oil, butter, lard |
| Sweeteners | Table sugar, honey, maple syrup |
| Seasonings | Salt, vinegar, herbs and spices |
| Flours & Starches | Wheat flour, corn starch, pasta (plain dried) |
Key rule: These are ingredients you'd use to cook with, not foods you'd eat as a meal by themselves.
NOVA Group 3: Processed Foods
Processed foods are made by adding Group 2 ingredients (salt, oil, sugar) to Group 1 foods, using simple methods like canning, bottling, or baking. The purpose is preservation or enhancing flavor. Crucially, they are recognizable as modified versions of the original food.
| Category | Examples |
|---|---|
| Canned & Preserved | Canned beans, canned tuna, canned tomatoes, pickles |
| Cheese & Dairy | Artisan cheese, mozzarella, cream cheese |
| Baked | Fresh bakery bread (flour, water, yeast, salt), tortillas |
| Cured & Smoked | Smoked salmon, beef jerky (simple ingredients), ham |
Key rule: You can still recognize what the original food was. The ingredient list is short (2–5 items).
NOVA Group 4: Ultra-Processed Foods (UPF)
This is the critical category — and the one driving the global health conversation. NOVA 4 ultra-processed foods are industrial formulations made mostly or entirely from substances derived from foods and additives. They contain ingredients you would never use in a home kitchen.
Hallmarks of NOVA 4 Foods
- Long ingredient lists (often 15–30+ ingredients)
- Industrial additives: emulsifiers, humectants, flavor enhancers, colorings
- Engineered for hyper-palatability: designed to override natural satiety signals
- Heavily marketed: bright packaging, brand recognition, convenience positioning
- Not recognizable as a modified version of any single whole food
| Category | NOVA 4 Examples |
|---|---|
| Beverages | Sodas, energy drinks, flavored milks, fruit "drinks" |
| Snacks | Chips, Doritos, Cheetos, packaged cookies, candy bars |
| Breakfast | Most breakfast cereals, Pop-Tarts, flavored instant oatmeal |
| Frozen | Frozen pizza, frozen dinners, chicken nuggets, fish sticks |
| Bakery | Mass-produced bread, packaged muffins, tortillas (with additives) |
| Dairy | Flavored yogurt, processed cheese slices, coffee creamers |
| Meat | Hot dogs, sausages, deli meats with nitrates/fillers |
| Sauces | Ketchup, BBQ sauce, ranch dressing, most salad dressings |
| Instant | Instant noodles, Cup Noodles, boxed mac and cheese |
How much of your cart is NOVA 4?
Mount Dorito scans your grocery receipt and classifies every item on the NOVA scale — giving you one clear number: your UPF percentage.
Try It Free →Common "Is It Ultra-Processed?" Questions
These foods trip people up the most. Here's where they fall on the NOVA scale:
| Food Item | NOVA Group | Why? |
|---|---|---|
| Frozen vegetables (plain) | 1 ✅ | Freezing is minimal processing |
| Canned beans | 3 | Just beans, water, salt |
| Store-bought bread | 4 ⚠️ | Dough conditioners, HFCS, preservatives |
| Bakery bread (5 ingredients) | 3 | Flour, water, yeast, salt, oil |
| Flavored yogurt | 4 ⚠️ | Emulsifiers, artificial sweeteners, stabilizers |
| Plain yogurt | 1 ✅ | Just milk and cultures |
| Protein bars | 4 ⚠️ | Engineered food products with 15+ ingredients |
| Peanut butter (just peanuts) | 1 ✅ | Ground peanuts only |
| Peanut butter (Jif/Skippy) | 4 ⚠️ | Hydrogenated oils, sugar, emulsifiers |
| Pasta sauce (jar) | 3 or 4 | Depends on ingredient list — check for additives |
| Orange juice | 1 | Pasteurized juice with no additives |
| Fruit punch / Kool-Aid | 4 ⚠️ | Artificial flavors, HFCS, colorings |
Why the NOVA Classification Matters
This isn't just academic taxonomy. A growing body of peer-reviewed research links high NOVA 4 consumption to serious health outcomes:
- A 2024 BMJ systematic review of 45 meta-analyses found that higher UPF intake is associated with 32 adverse health outcomes, including heart disease, cancer, type 2 diabetes, anxiety, and depression [2].
- A 2024 BMJ study tracking 100,000+ health professionals for 30 years showed that higher UPF consumption is significantly associated with increased mortality risk [3].
- An NIH controlled trial found that people on an ultra-processed diet consumed 500 more calories per day compared to an unprocessed diet — even when both diets were matched for nutrients [4].
- Ultra-processed food makes up approximately 58% of the average American adult's caloric intake [5].
How to Track Your NOVA 4 Consumption
Understanding the NOVA system is step one. Step two is knowing how much NOVA 4 food you're actually buying.
Most people dramatically underestimate their ultra-processed food consumption because so many UPF items are marketed as "healthy" — granola bars, whole grain cereal, flavored yogurt, protein shakes.
Mount Dorito solves this by scanning your grocery receipts and automatically classifying every item on the NOVA scale. It works two ways:
- Snap a photo of any paper receipt — AI classifies every item in seconds
- Auto-sync your store accounts (Costco, Walmart, H‑E‑B, Sam's Club) — receipts import automatically
You get one clear number: your UPF percentage. Track it over time, see your spending on junk vs. real food, and climb the mountain as your score improves.
Summary: NOVA at a Glance
| Group | Name | Key Indicator | Action |
|---|---|---|---|
| NOVA 1 | Unprocessed / Minimally Processed | No added ingredients | Eat freely ✅ |
| NOVA 2 | Processed Culinary Ingredients | Extracted from NOVA 1 | Cook with in moderation |
| NOVA 3 | Processed Foods | NOVA 1 + NOVA 2, short ingredient list | Generally fine |
| NOVA 4 | Ultra-Processed Foods (UPF) | Industrial additives, 5+ ingredients | Reduce intake ⚠️ |
Related Articles
- What Is Ultra-Processed Food? A Simple Guide to the NOVA Scale
- 5 Easy Swaps to Cut Ultra-Processed Food
- The Hidden Cost of Junk Food: How Much Are You Really Spending?
- Why Barcode Scanners Don't Work for UPF Tracking
References
- Monteiro CA, et al. "Ultra-processed foods, diet quality, and health using the NOVA classification system." FAO, Rome, 2019.
- Lane MM, et al. "Ultra-processed food exposure and adverse health outcomes: umbrella review of epidemiological meta-analyses." BMJ, 2024;384:e077310.
- Wang L, et al. "Ultra-processed food consumption and risk of mortality." The BMJ, 2024;385:e078476.
- Hall KD, et al. "Ultra-Processed Diets Cause Excess Calorie Intake and Weight Gain." Cell Metabolism, 2019;30(1):67-77.
- NYU School of Global Public Health. "Ultra-processed food now accounts for 58% of calories consumed by U.S. adults." 2024.
Note: This article is for informational purposes only and is not medical advice. Consult a qualified healthcare professional for dietary guidance.
Want to know your UPF percentage?
Mount Dorito scans your grocery receipt and scores your entire cart on the NOVA scale — instantly.
Download Free