You've probably heard the term "ultra-processed food" in the news lately. It's in headlines, on podcasts, even on Netflix documentaries. But what does it actually mean? Is a protein bar ultra-processed? What about bread? Or frozen vegetables?
The answer lies in a classification system called NOVA — and once you understand it, you'll never look at your grocery cart the same way.
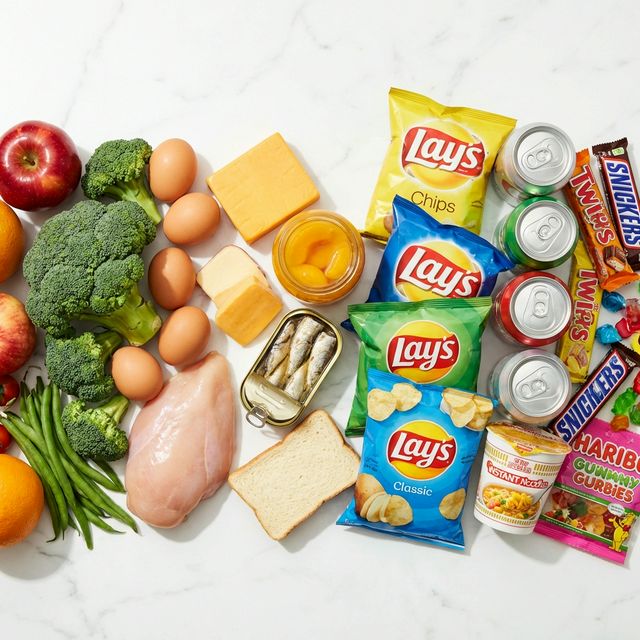
The NOVA Scale: 4 Groups, No Fuss
NOVA was developed by researchers at the University of São Paulo in Brazil, led by Dr. Carlos Monteiro [1]. Unlike traditional nutrition labels that focus on calories and macronutrients, NOVA classifies food based on how much it has been industrially processed — not what's in it, but what's been done to it.
There are four groups:
| Group | What It Is | Examples |
|---|---|---|
| Group 1 | Unprocessed or minimally processed foods | Fresh fruits, vegetables, eggs, plain rice, meat, fish, milk |
| Group 2 | Processed culinary ingredients | Olive oil, butter, salt, sugar, flour, vinegar |
| Group 3 | Processed foods | Canned beans, cheese, smoked salmon, fresh-baked bread |
| Group 4 | Ultra-processed foods (UPF) | Sodas, chips, instant noodles, frozen dinners, packaged cookies, most breakfast cereals |
The key distinction is Group 4. Ultra-processed foods are industrial formulations made mostly or entirely from substances derived from foods — plus additives. They contain ingredients you'd never use in a home kitchen: high-fructose corn syrup, hydrogenated oils, emulsifiers, artificial flavors, and preservatives with names you can't pronounce.
The Quick Test: Is It Ultra-Processed?
Here's a simple rule of thumb: flip the package over and read the ingredient list. If it contains more than 5 ingredients and includes substances you wouldn't find in a home kitchen, it's almost certainly Group 4.
Some examples that surprise people:
- Flavored yogurt — often Group 4 (emulsifiers, artificial sweeteners, stabilizers). Plain yogurt is Group 1.
- Whole wheat bread from the store — frequently Group 4 (dough conditioners, preservatives, high-fructose corn syrup). Bakery bread with 5 ingredients is Group 3.
- Protein bars — almost always Group 4. They're engineered food products, not minimally processed.
- Frozen vegetables (plain) — Group 1! Freezing is minimal processing. But frozen dinners with sauces? Group 4.
Why Should You Care?
This isn't just academic classification. A growing body of research links high UPF consumption to serious health outcomes:
- A 2024 BMJ systematic review of 45 pooled meta-analyses found that higher UPF intake is associated with 32 adverse health outcomes, including heart disease, cancer, type 2 diabetes, anxiety, and depression [2].
- A 2024 study in The BMJ tracking over 100,000 health professionals for 30 years showed that higher UPF consumption is significantly associated with increased mortality risk [3].
- Research from the National Institutes of Health demonstrated that people on an ultra-processed diet consumed 500 more calories per day compared to an unprocessed diet — suggesting UPF overrides the body's natural fullness signals [4].
Ultra-processed food makes up roughly 58% of the average American adult's caloric intake. For children and adolescents, it's closer to 67%. [5]
That's not a minor dietary footnote — it's the majority of what most people eat.
Curious about your own number?
Mount Dorito scans your grocery receipt and tells you exactly what percentage is ultra-processed — in seconds.
Try It Free →What's Your Number?
The hardest part about UPF isn't understanding what it is — it's knowing how much of it you're actually eating. Most people dramatically underestimate their UPF consumption because so many ultra-processed items are marketed as "healthy" (granola bars, fruit juice, whole grain cereal).
That's exactly why we built Mount Dorito. Snap a photo of your grocery or restaurant receipt, and our AI classifies every single item on the NOVA scale — giving you one clear number: your UPF percentage.
No barcode scanning. No manual food logging. Just a receipt and the truth.
Getting Started: What "Good" Looks Like
There's no universally agreed-upon "goal" UPF percentage, but here's a practical framework:
- 70%+ UPF: This is the danger zone. Most of your cart is industrial food. Time for a serious audit.
- 50–70% UPF: Average American territory. Room for major improvement.
- 30–50% UPF: You're doing better than most. Focus on swapping your top repeat offenders.
- Under 30% UPF: Excellent. You're eating mostly real food. Maintain it.
Remember: the goal isn't perfection. It's awareness, then gradual improvement. Even dropping from 58% to 40% is a meaningful health win.
Bottom Line
Ultra-processed food is the biggest shift in the human diet in the last 50 years — and most people have no idea how much of it they're eating. The NOVA scale gives you a framework to understand it. What you do with that knowledge is up to you.
But you can't fix what you can't measure.
Related Articles
- 5 Easy Swaps to Cut Ultra-Processed Food
- The Hidden Cost of Junk Food: How Much Are You Really Spending?
- Why Barcode Scanners Don't Work for UPF Tracking
References
- Monteiro CA, et al. "Ultra-processed foods, diet quality, and health using the NOVA classification system." FAO, Rome, 2019.
- Lane MM, et al. "Ultra-processed food exposure and adverse health outcomes: umbrella review of epidemiological meta-analyses." BMJ, 2024;384:e077310.
- Wang L, et al. "Ultra-processed food consumption and risk of mortality." The BMJ, 2024;385:e078476.
- Hall KD, et al. "Ultra-Processed Diets Cause Excess Calorie Intake and Weight Gain." Cell Metabolism, 2019;30(1):67-77.
- NYU School of Global Public Health. "Ultra-processed food now accounts for 58% of calories consumed by U.S. adults." 2024.
Note: This article is for informational purposes only and is not medical advice. Consult a qualified healthcare professional for dietary guidance.
Want to know your UPF percentage?
Mount Dorito scans your grocery receipt and scores your entire cart — instantly.
Download Free