You downloaded a food scanning app. Maybe it was Yuka. Maybe Open Food Facts. Maybe one of the dozen others that promise to "decode" your food.
You scanned a few items. Got some color-coded scores. Felt informed for about 48 hours.
Then you stopped using it.
You're not alone. The vast majority of barcode scanning app users abandon them within the first two weeks [1]. Not because they're bad apps — but because per-item barcode scanning is fundamentally the wrong approach for tracking ultra-processed food consumption.
Here's why — and what actually works.
Problem 1: Friction Kills Habit
Think about what barcode scanning actually requires:
- Pick up item from shelf
- Open app
- Find barcode on package
- Hold phone steady and scan
- Wait for result
- Read the score
- Repeat 30-40 times per shopping trip
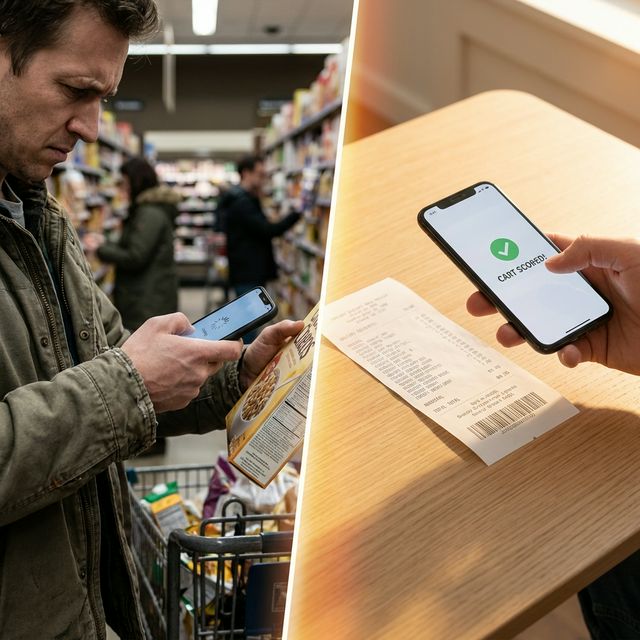
That's 30-40 individual actions per trip. Even if each scan takes 10 seconds, you're adding 5-7 minutes of scanning to every grocery run — while blocking the aisle, juggling a cart, and probably wrangling a kid.
Compare that to receipt scanning: one photo, 3 seconds, entire cart scored. The friction difference isn't marginal — it's orders of magnitude. And in habit formation, friction is everything [2].
Problem 2: One Item Doesn't Tell You Anything
Knowing that a specific granola bar scored 45/100 is mildly interesting. But it doesn't answer the question that actually matters:
How much of my overall diet is ultra-processed?
Get your entire cart scored — in one photo
Mount Dorito scans your receipt and classifies every item. No barcodes, no manual entry.
Try It Free →That's a cart-level question, not an item-level question. Your health outcomes aren't determined by whether one yogurt is a 35 or a 72. They're determined by the aggregate — what percentage of your total food intake is ultra-processed over weeks and months [3].
Barcode scanners give you item scores. What you need is a portfolio score — the big picture of your entire grocery pattern.
Problem 3: No Trend Tracking
Even if you diligently scan every item, most barcode apps don't track your patterns over time. They're designed as single-lookup tools: scan → score → forget.
But behavior change requires trend data:
- Is my UPF percentage going up or down month over month?
- Which items do I keep buying that are dragging my score down?
- How much money am I shifting from UPF to whole food?
- Am I actually making progress, or just feeling like I am?
Without trend data, you're flying blind. You might feel like you're eating better, but the numbers might tell a different story. Research shows that self-assessment of diet quality is unreliable — people consistently overestimate how well they eat [4].
Problem 4: Missing Database Coverage
Barcode databases are impressive — Open Food Facts has over 3 million products. But they're still incomplete. Store brands, regional products, and recently launched items often return "product not found." When that happens in the middle of a shopping trip, most users give up on the rest of their cart.
Receipt-based tracking sidesteps this entirely. The item name on a receipt is enough to classify it using modern AI — no barcode needed, no database lookup, no "product not found" dead ends.
What Actually Works: Receipt-Based Tracking
The approach that solves all four problems is simple: scan the receipt, not the items.
| Feature | Barcode Scanners | Receipt Scanning |
|---|---|---|
| Time per trip | 5-7 min (30-40 scans) | 3 seconds (1 photo) |
| Cart-level score | ❌ Item-level only | ✅ Entire cart scored |
| Trend tracking | ❌ No history | ✅ Weekly/monthly trends |
| Spending analytics | ❌ Not available | ✅ UPF vs. whole food spend |
| Repeat buy tracking | ❌ Not available | ✅ Top offenders flagged |
| Store auto-sync | ❌ Not possible | ✅ Link store, never scan |
| Coverage | ⚠️ Database-dependent | ✅ AI-based, any item |
| Retention (2-week) | ~15% | Significantly higher |
Even Better: Auto-Sync
Receipt scanning reduces friction from 40 actions to 1. But there's an even lazier option: link your grocery store account.
If your store has an online account or loyalty program — Walmart, Kroger, Target, H-E-B, and many others — you can connect it once. From that point on, every purchase is automatically imported, classified, and scored. Zero scanning. Zero effort. Your UPF percentage updates itself.
This is the ideal state: tracking that doesn't require you to remember to track. It happens in the background while you live your life.
The Right Question to Ask
Barcode scanners answer: "Is this one item good or bad?"
Receipt-based tracking answers: "How is my overall diet trending, and what's the most impactful thing I can change next?"
The second question is the one that actually leads to healthier outcomes. A 2024 BMJ study tracking over 100,000 people for 30 years confirmed that it's sustained, pattern-level reduction in UPF — not individual food choices — that drives meaningful health improvements [5].
You need a tool that measures patterns. Not one that scores snacks.
Related Articles
- What Is Ultra-Processed Food? A Guide to the NOVA Scale
- I Tracked My Cart for 30 Days
- 5 Easy Swaps to Cut Ultra-Processed Food
References
- BuildFire. "App Statistics: User Retention, Engagement, and Usage Data."
- Clear J. "Habit Stacking: How to Build New Habits by Taking Advantage of Old Ones." JamesClear.com.
- Lane MM, et al. "Ultra-processed food exposure and adverse health outcomes." BMJ, 2024;384:e077310.
- Vella-Zarb RA, et al. "Accuracy of self-reported dietary intake." BMC Public Health, 2020.
- Wang L, et al. "Ultra-processed food consumption and risk of mortality." The BMJ, 2024;385:e078476.
Note: Comparisons are based on general product capabilities and publicly available information. Individual experiences may vary.
Stop scanning barcodes one at a time
One receipt. Your whole cart. Your real UPF number.
Try Mount Dorito Free